> ## Documentation Index
> Fetch the complete documentation index at: https://wundergraphinc-brendan-add-sof-link.mintlify.site/llms.txt
> Use this file to discover all available pages before exploring further.
# Advanced Request Tracing (ART)
> This section is about Advanced Request Tracing (ART) and how you can leverage it to debug execution plans and understand exactly how the Router resolves a request.
 Enabling Advanced Request Tracing may pose a potential security risk. For this reason, we have implemented a mechanism to ensure secure communication from Cosmo Studio to your routers. This allows to debug routers in production
A connection with the controlplane is **required** and a router with version **0.42.3** or **higher.**
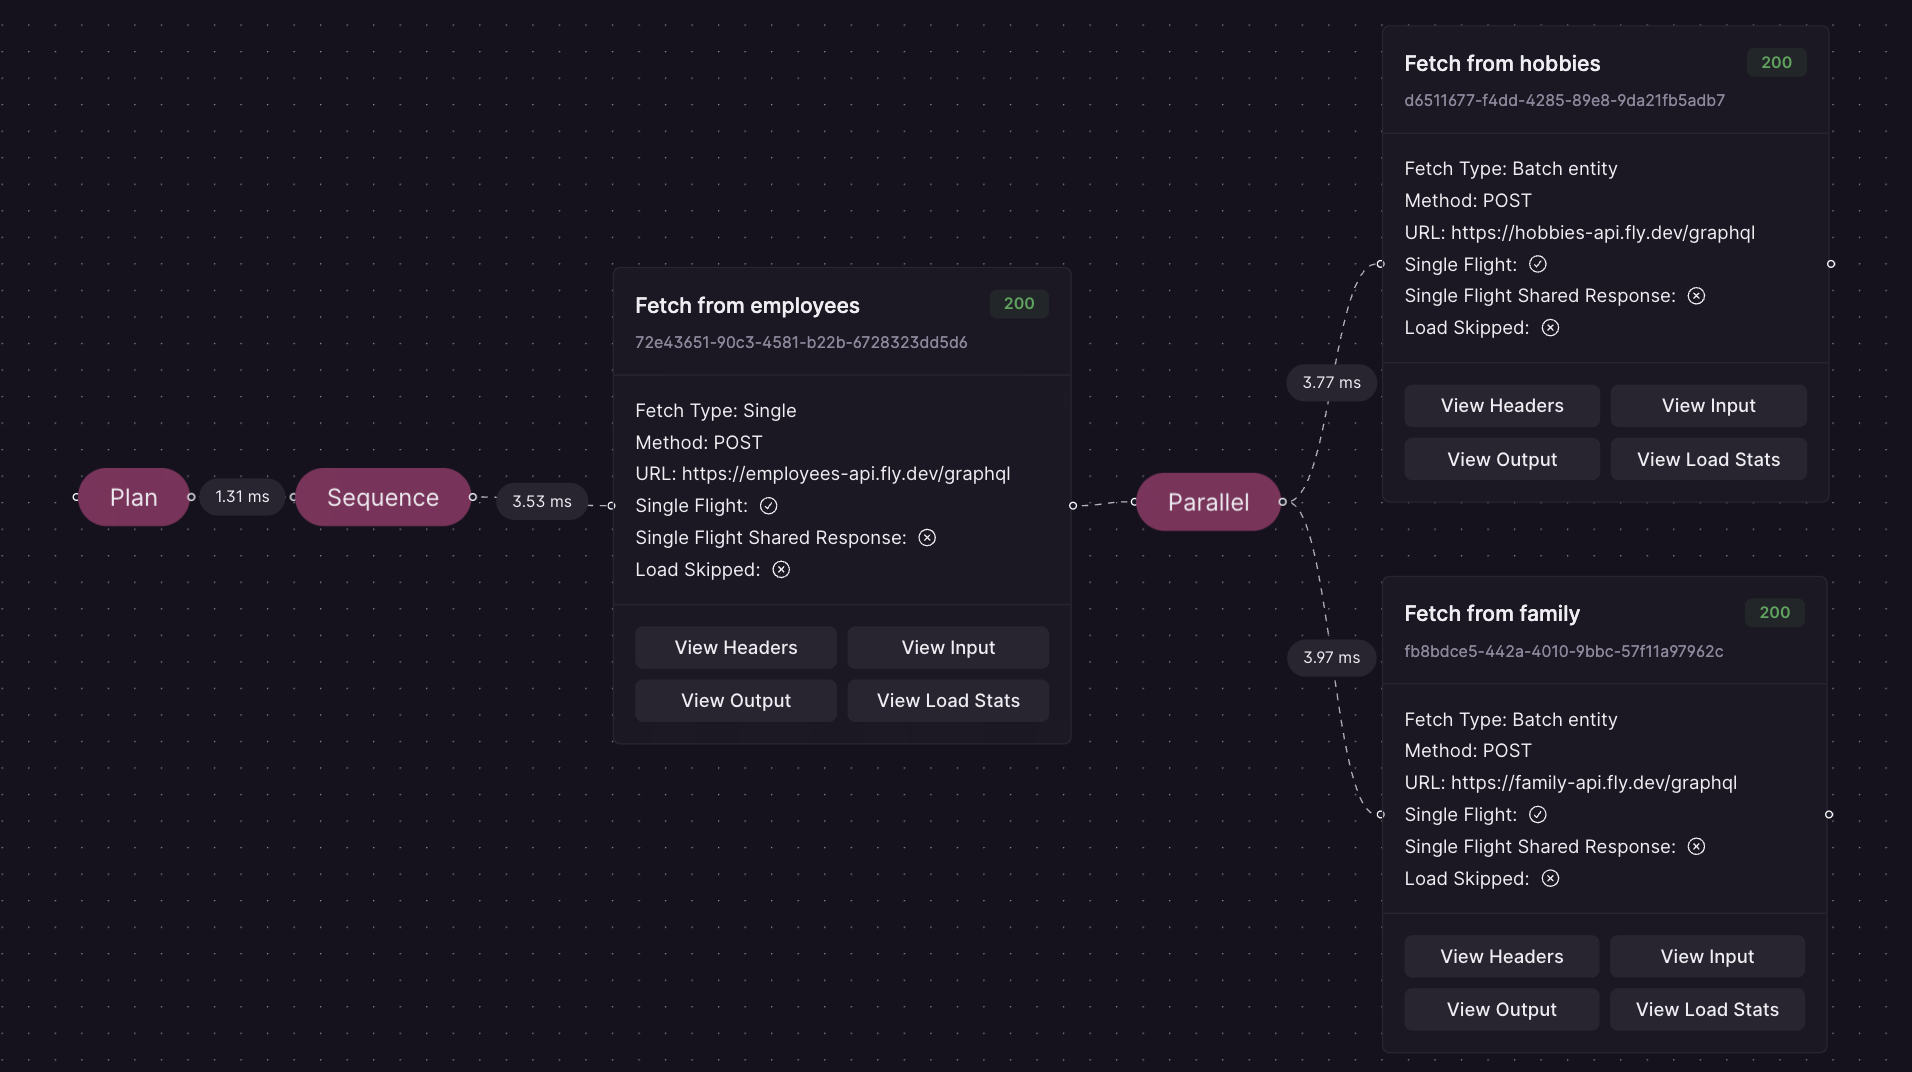
Advanced Request Tracing (ART) renders the Execution Plan including verbose information about how it was resolved as a JSON and adds it to the GraphQL response in the "extensions" part of the response using the "trace" key.
You get the following information from ART
* planning timings, e.g. how long it took to generate an execution plan
* the general structure of the execution plan
* the types of fetches (load operations) the Router does, like parallel, serial, entity, batch entity, etc.
* what actual requests are being sent to the Subgraphs
* what data was used to render the input for a load operation
* the rendered input of a load operation
* the output of a load operation
* the timings, like latency, of a load operation
All of this information can be quite useful to fully understand how the Router resolves a request and why it might be slow or behave unexpectedly.
## Configuration
For convenience, **Advanced Request Tracing is enabled by default**. When starting the Router, a warning indicates if the feature is active.
To fully disable Advanced Request Tracing, set the following environment variable:
```bash theme={null}
ENGINE_ENABLE_REQUEST_TRACING=false
```
### Request Parameters
To use Advanced Request Tracing, you need to either use Request Headers or Query Parameters. To disable ART, simply omit the "X-WG-Trace" Header or the "wg\_trace" Query Parameter.
#### Headers
You must set the following Header to enable tracing
```bash theme={null}
X-WG-Trace=true
```
#### Query Parameter
It's also possible to use Query Parameters
```bash theme={null}
POST http://example.com/graphql?wg_trace=true
```
#### Optional Arguments
Other (optional) arguments that are available:
* exclude\_planner\_stats (exclude planner timings in the trace)
* exclude\_raw\_input\_data (exclude the raw input data for a loader)
* exclude\_input (exclude the rendered input data for a loader)
* exclude\_output (exclude the output of a loader)
* exclude\_load\_stats (exclude load stats like latency)
* enable\_predictable\_debug\_timings (useful for debugging, makes timings constant)
### Examples
#### Enable Advanced Tracing but exclude planner stats and input via Header
```bash theme={null}
X-WG-Trace=exclude_planner_stats,exclude_input
```
#### Enable Advanced Tracing but exclude output via Query Parameters
```bash theme={null}
POST http://example.com/graphql?wg_trace=exclude_output
```
## Development
For security reasons, we don't enable Advanced Request Tracing (ART) by default but you can enable it by setting the router environment variable `DEV_MODE` to `true` and using the following header in the playground:
```bash theme={null}
{
"X-WG-TRACE" : "true"
}
```
Enabling Advanced Request Tracing may pose a potential security risk. For this reason, we have implemented a mechanism to ensure secure communication from Cosmo Studio to your routers. This allows to debug routers in production
A connection with the controlplane is **required** and a router with version **0.42.3** or **higher.**
Advanced Request Tracing (ART) renders the Execution Plan including verbose information about how it was resolved as a JSON and adds it to the GraphQL response in the "extensions" part of the response using the "trace" key.
You get the following information from ART
* planning timings, e.g. how long it took to generate an execution plan
* the general structure of the execution plan
* the types of fetches (load operations) the Router does, like parallel, serial, entity, batch entity, etc.
* what actual requests are being sent to the Subgraphs
* what data was used to render the input for a load operation
* the rendered input of a load operation
* the output of a load operation
* the timings, like latency, of a load operation
All of this information can be quite useful to fully understand how the Router resolves a request and why it might be slow or behave unexpectedly.
## Configuration
For convenience, **Advanced Request Tracing is enabled by default**. When starting the Router, a warning indicates if the feature is active.
To fully disable Advanced Request Tracing, set the following environment variable:
```bash theme={null}
ENGINE_ENABLE_REQUEST_TRACING=false
```
### Request Parameters
To use Advanced Request Tracing, you need to either use Request Headers or Query Parameters. To disable ART, simply omit the "X-WG-Trace" Header or the "wg\_trace" Query Parameter.
#### Headers
You must set the following Header to enable tracing
```bash theme={null}
X-WG-Trace=true
```
#### Query Parameter
It's also possible to use Query Parameters
```bash theme={null}
POST http://example.com/graphql?wg_trace=true
```
#### Optional Arguments
Other (optional) arguments that are available:
* exclude\_planner\_stats (exclude planner timings in the trace)
* exclude\_raw\_input\_data (exclude the raw input data for a loader)
* exclude\_input (exclude the rendered input data for a loader)
* exclude\_output (exclude the output of a loader)
* exclude\_load\_stats (exclude load stats like latency)
* enable\_predictable\_debug\_timings (useful for debugging, makes timings constant)
### Examples
#### Enable Advanced Tracing but exclude planner stats and input via Header
```bash theme={null}
X-WG-Trace=exclude_planner_stats,exclude_input
```
#### Enable Advanced Tracing but exclude output via Query Parameters
```bash theme={null}
POST http://example.com/graphql?wg_trace=exclude_output
```
## Development
For security reasons, we don't enable Advanced Request Tracing (ART) by default but you can enable it by setting the router environment variable `DEV_MODE` to `true` and using the following header in the playground:
```bash theme={null}
{
"X-WG-TRACE" : "true"
}
```